Shining a Light on SAMS Data
Shining a Light on SAMS Data
The City of Ottawa's Case Management Tool
By: Kurt DesRoches
September 2024
 The City of Ottawa’s Case Management Tool (CMT) is a suite of Power BI Dashboards designed to provide timely and accurate information to case workers and management. The dashboards were created using Social Assistance Management System (SAMS) Data Extracts sent by the Province in the form of roughly 170 xml files every day. It was an extensive project that brought IT, Social Services and the City of Ottawa’s Social Policy and Analytics teams together to create a reliable, user-friendly and accurate dataset.
Prior to this, Ottawa relied on reports from Social Assistance Legacy Information (SALI) for performance metrics and manually-maintained Excel files to keep on top of caseloads. While the Case Management Tool suite itself is what users interact with most, the underlying data model is the true hero that allows us to answer questions about our clients and services that we couldn’t reliably answer in the past.
The Past
The City of Ottawa, like many municipalities and regions, was using reports from SALI and a maze of Excel trackers in order to understand our case loads and keep track of metrics. The SALI reports were problematic in that we couldn’t explain how the information in them was obtained. A famous example is the Employment Expenses Report, where the totals between the detailed tab and summarized tab didn’t match. Which was correct? We didn’t know. For anything not present in Provincial reports, we made do with hundreds of manual Excel trackers.
One of these was the previous Case Management Tool, which was an Excel template that case workers would populate with their list of clients, due dates for 24 month reviews and outcome plans, case statuses and various other columns that staff could make for themselves. While this format allowed for a lot of customization, it also relied on the accuracy of manual inputs. On top of that, supervisors had to wade through all their staff’s individual CMTs to ensure targets were being met.
Before the new SAMS Data Model was created, an interim dashboard was made by splicing together various SALI reports. While it allowed for easier analysis of the reports, it couldn’t solve the accuracy problems in the reports nor the timelines that those reports were released (often monthly, but dates varied).
Development
Since Ottawa was receiving the SAMS Data Extracts from the Province, the first step was to stage them into a database. Since each day’s extracts only reported new additions and changes made in Ottawa, we couldn’t simply load in the latest dates files. They all needed to be loaded in order using a method that understood to overwrite information that was a change to previous day’s files. Toronto had provided us the code they used to do this. Our IT department used this code as a basis and built their own data staging job using the programming languages and tools used in Ottawa. While it took many months to stage and test, the staging job produced very few errors.
From there, the data had to be molded into something usable and accurate. The tables by themselves are riddled with missing and misleading information. For example, tables linked to SAMS Evidence will have a column for a Member ID. However, the Member ID will always show the Applicant’s Member ID, even if the Evidence is for a dependent or spouse. Only through combining multiple tables and thorough testing of how the data works can we actually come up with good queries that output information matching the front-end of SAMS. This also took months of development and testing.
Once we had reliable queries, we proceeded to create dashboards for users to view the data. We decided to make a suite of dashboards catering to specific user bases: case workers, supervisors, and upper management. Case workers’ dashboards would have Row-Level Security, allowing them only to see their own cases based on their login credentials. The information they saw would also be the most granular and specific. Supervisors would be able to see all cases, but could also filter down by offices or teams as needed. The information they saw would be catered to allow them to make sure tasks were being completed. Finally, upper management would have aggregated information on their dashboard that showed demographics and performance targets.
The case worker dashboard would be released first, followed by the supervisor and upper management versions. This was done intentionally; case workers know their caseloads well and were able to point out inaccuracies quickly. This allowed queries and filters to be adjusted before their supervisors got access to information that may have been inaccurate and made it seem like everyone was ahead or behind in tasks. While we did have a small test group with case workers, nothing can beat the feedback of over 150 staff looking at their individual caseloads.
The Present
The Case Management Tool suite is used by over 180 users including the supervisors and managers. The case worker version was the number one most used dashboard by the City of Ottawa for many months (it’s number two as of the time of writing). The dashboards have become part of day-to-day operations and are seen as a definite upgrade to what was available before.
Beyond the dashboards, the underlying data set built from the SAMS Data Extracts has become instrumental in answering questions about our caseloads. This data set is now our first stop any time we are looking to have ad-hoc reports or to validate and track initiatives. This includes tracking specific Additional Benefit issuance, client earnings, converting Outcome Plans to Action Plans, and more!
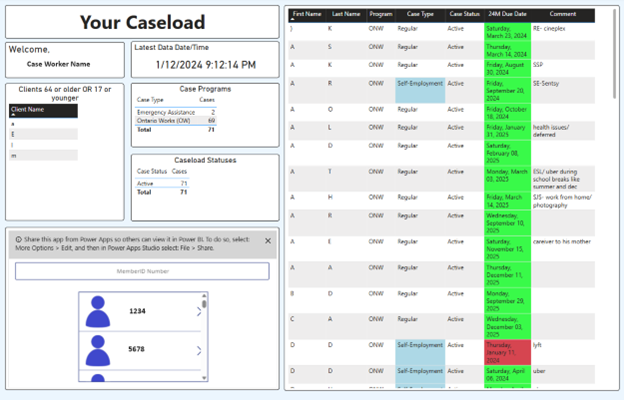 |
| Image: Redacted screenshot of the Caseload tab on a Case Worker’s Case Management Tool |
The Future
A new SAMS Data Model is currently being developed using lessons learned from the initial model used to make the existing Case Management Tool suite. The goal is to create a new version of the Case Management Tools based off this new model which would increase performance and visibility over what is currently available. A major feature will be visibility into clients beyond the Applicant, allowing for a more accurate view into what a caseload looks like and it should also help inform better caseload balancing. The new model is nearly ready and is currently being used to answer research questions and generate ad-hoc reports.
As the Province looks to potentially release more data, we are well-positioned to adapt and assimilate it into our model. We’re looking forward to getting new extracts related to Employment Services Transformation and potentially Applications. These are currently blind spots in the information we receive, and it is crucial for operations to get visibility into this data as soon as possible.
Community of Practice
While we wait for improvements to data access from the Province, we are starting up an inter-municipal Community of Practice for those that work out of databases made from the SAMS Data Extracts. Many of us across Ontario are doing similar work but we’ve built up our knowledge and techniques more or less in silos. The intent for this group is to share knowledge and solve problems together through virtual meetings. Through everyone’s combined experience and skills we will not only be able to improve on data tools that we already have, but we would also be able to map out new SAMS data sources faster as they release.
We will be having our kickoff meeting in August and currently have six municipalities signed up. The Community of Practice is currently only open to those who are actively working out of databases created from the SAMS Extracts. As we develop, we may open the group to others who are looking to start working the SAMS Extracts or with any other data-sharing format the Province may launch in the future. If you’re interested in joining, please fill out this form and we’ll get in touch!
Wrapping Up
The City of Ottawa’s Case Management Tool is a successful replacement to working out of the Provincial SAMS reports. It’s more accurate, more timely and more user-friendly. It comes in the form of a suite of Power BI dashboards tailored to the needs of the user groups. These dashboards are operationalized and are the prime sources of information for Ontario Works case management.
However, the Case Management Tool is just one product developed from having staged a database from the SAMS Data Extracts. From this dataset, we are able to develop our own ad-hoc reports and answer research questions quickly and with confidence. It has also shone a light onto areas of SAMS we haven’t paid as much attention to in the past, and we are also constantly upgrading our data sets to make them more accurate or incorporate new information as we learn how it works.
The City of Ottawa is not alone in working out of this dataset. Other municipalities have made incredible tools and helped us with some of the groundwork. Because we’ve all built our own tools in our own ways, we’d like to come together and share what we’ve learned and come up with solutions together as one hivemind of experts. We will do this through a SAMS Data Community of Practice, which holds its first meeting in August.
About the Author

Kurt is a 14-year veteran of the City of Ottawa and has front-line experiences through many facets of the organization and understands data from its rawest form. He is a self-taught data analyst who learned by applying his data curiosity to the work he was doing. For the last two years he has taken his off the desk passion into a full-time position where he works for a centralized data, analytics and research team at the City of Ottawa. In addition to improving his machine-based languages such as DAX and SQL, he also enjoys more "human" languages recently and achieved his JLPT N3 (intermediate) Japanese certification. If you’d like to contact him about SAMS Data, feel free to reach out at kurt.desroches@ottawa.ca
Blog categories: Case Management, Ontario Works, SAMS, Data, Dashboard, City of Ottawa