ROI's Community Wellbeing Dashboard
Providing Access to Rural Data for Decision Making: ROI's Community Wellbeing Dashboard
By: Danielle Letang
November 2024
 Rural Data Issues
Rural communities often struggle to find information to support decision making. Not only can rural data be difficult to find, it’s also difficult to work with. Most rural municipalities don’t have a data analyst on staff to gather, analyze, and interpret data. But all municipalities have to make the same decisions, whether or not they have capacity for data analysis. Therefore, it’s critical to make rural data more easily accessible and understandable for decision makers.
Rural Data Solution
The Rural Ontario Institute (ROI) has developed a Community Wellbeing Dashboard that improves access to information for decision making.
Communities can use the dashboard to:
- Establish a baseline
- Identify priorities for change
- Develop policies
- Measure progress over time
We engaged with a focus group of rural data champions to help us select indicators and data. With their help, we selected 90 indicators that are relevant for understanding rural wellbeing. And we selected 10 data sources that are focused on the community level.
Note that the dashboard currently features data for 60 out of the 90 indicators. We are still searching for data sources or proxies for 30 indicators related to:
- Community safety
- Health
- Civic engagement
- Labour force
- Environmental hazards
Community Wellbeing Dashboard
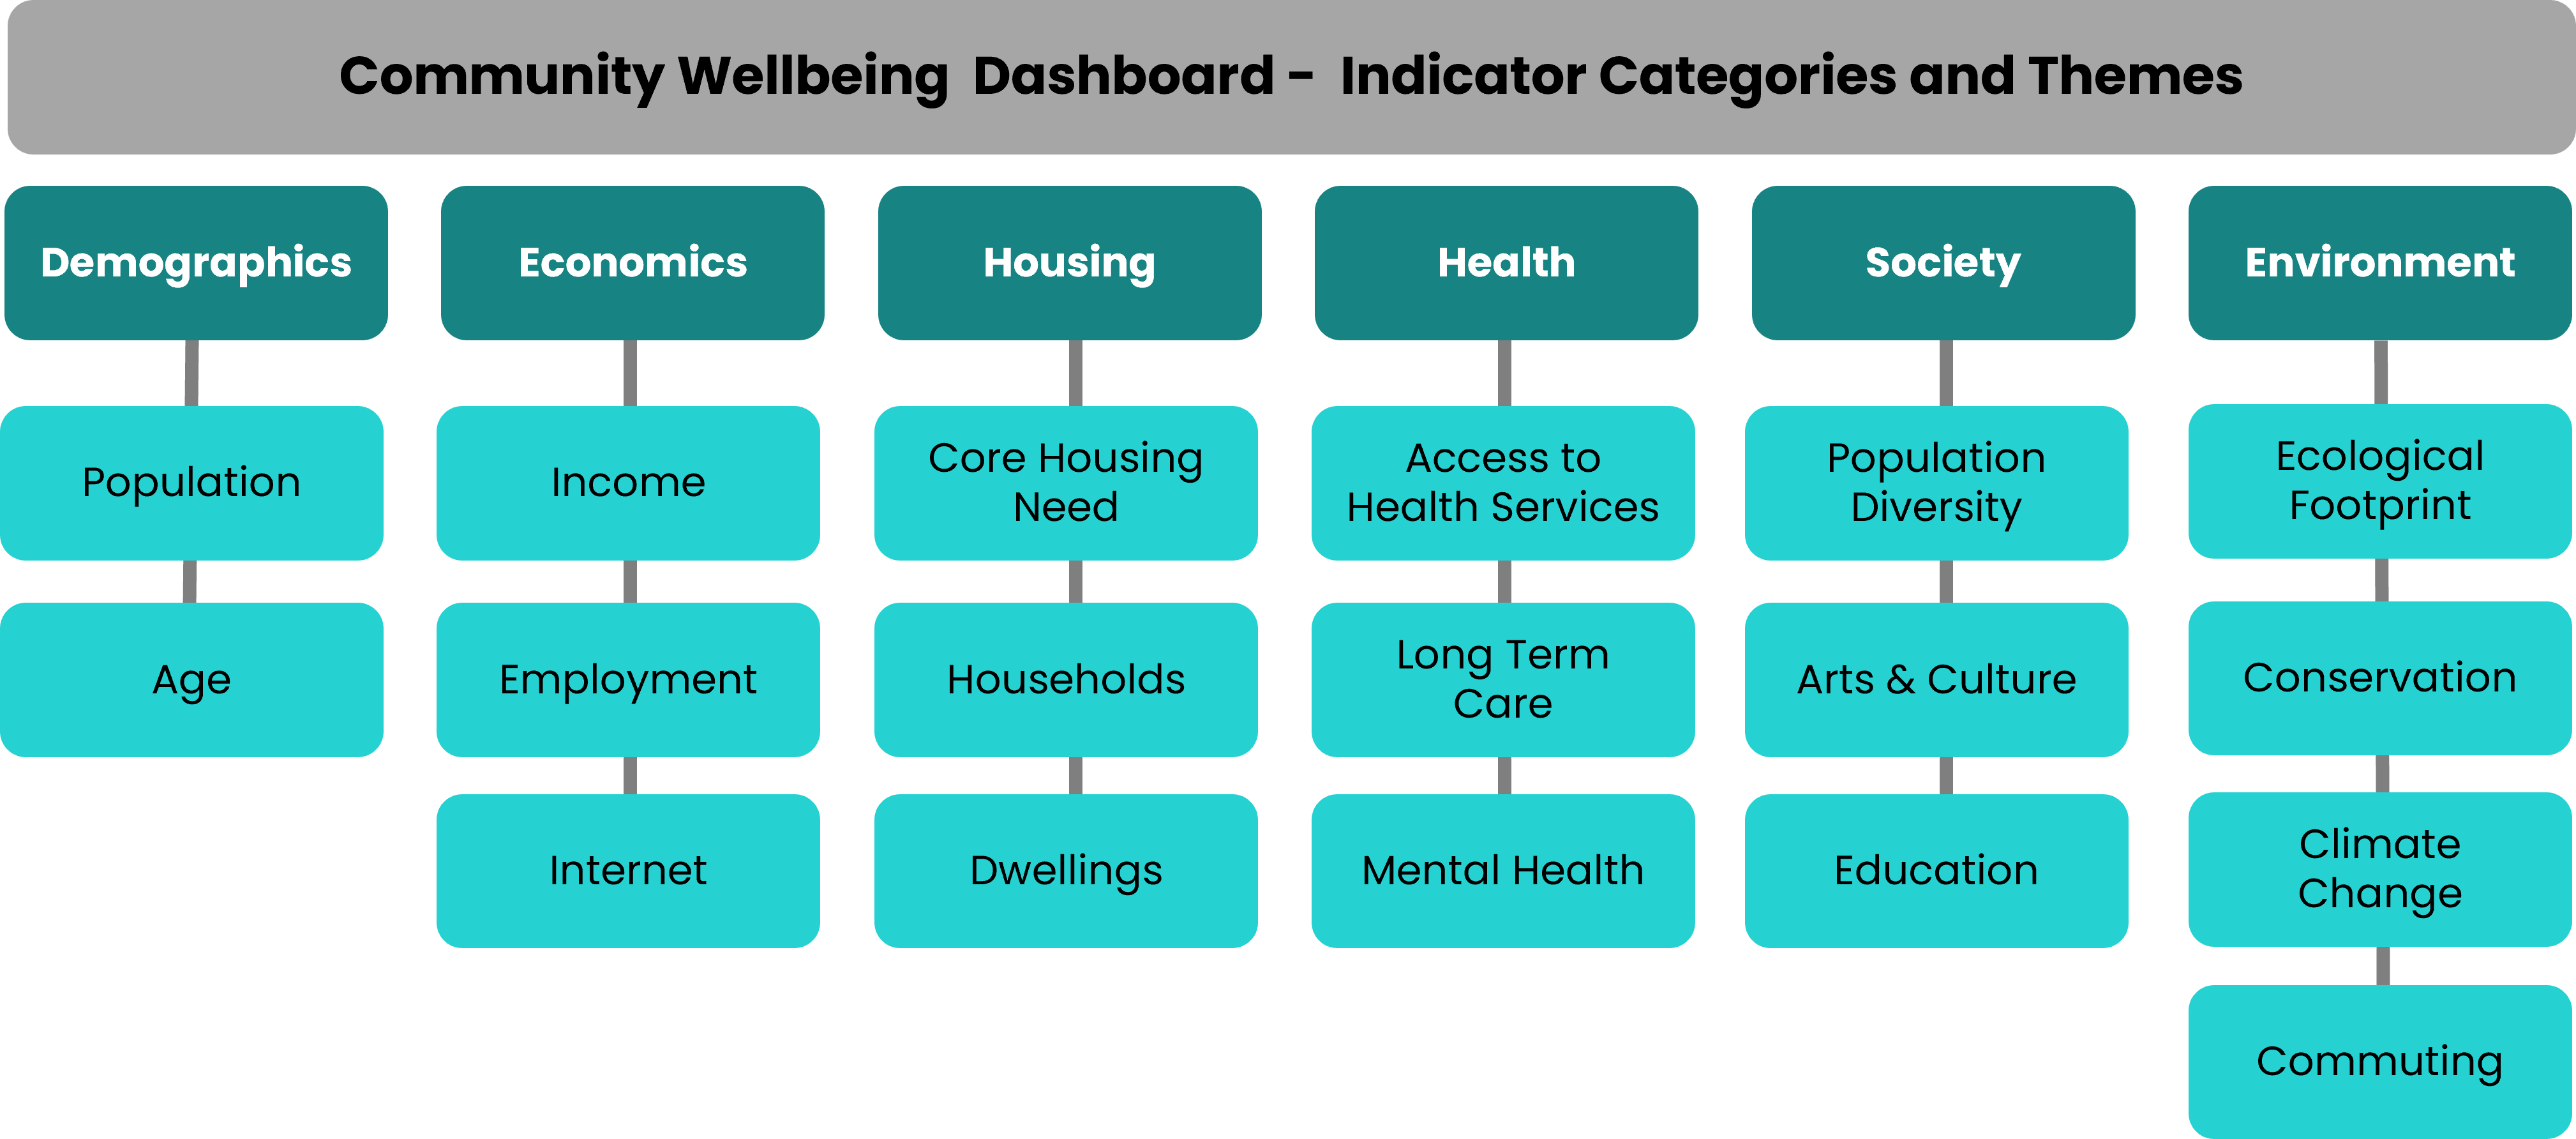
The indicators are organized into categories and themes. There are separate dashboard pages for each category. The overview pages provide a map for spatial context so you can see how and where your community fits within regional or provincial patterns. Each page has a comparison table with overall totals for First Nations, Rural, and Urban communities to further contextualize your community’s situation.
At the bottom of every page, there is a community table with indicator data for each community. The default selection is all communities in Ontario, but the dashboard can be filtered by region, community type, or community.
 |
| Image: Dashboard organization by indicator categories and themes |
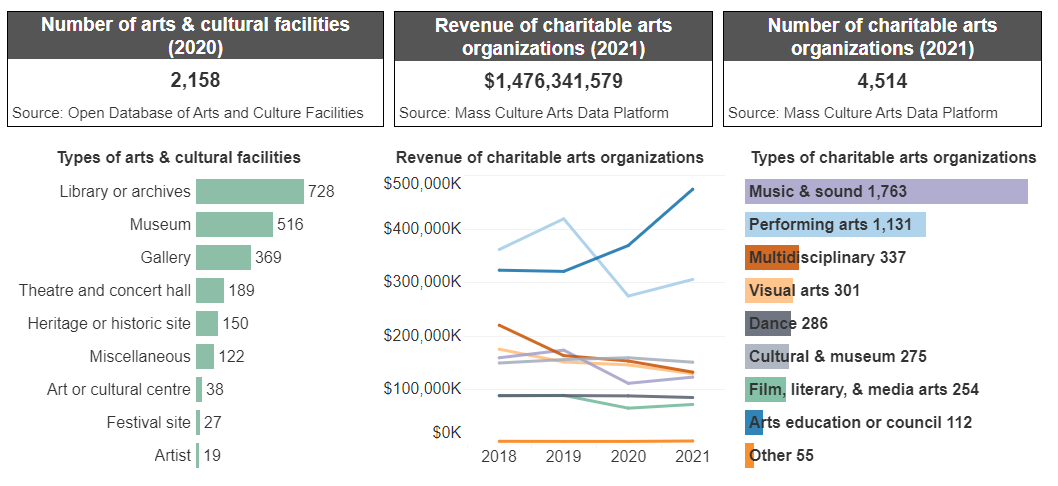
The theme pages feature smaller groupings of indicators that tell a story about wellbeing. These pages also include data visualizations that provide more detail for the indicators.
 |
| Image: Arts & culture indicators from the Society dashboard page |
Knowledge Mobilization
ROI is hosting knowledge mobilization and engagement sessions to help communities make use of the dashboard and its data. We are happy to meet with individuals or groups to provide demonstrations and answer questions. We also prepared a short video user guide to help you navigate this tool.
The Community Wellbeing Dashboard has many possible uses. It can be a great starting point for understanding your current community context. You could use the dashboard to develop a business case for policy or program development. Since the indicators will be updated regularly, you can also use the dashboard to measure progress or track performance over time. For example, you might use this tool to review your Community Safety and Wellbeing plan.
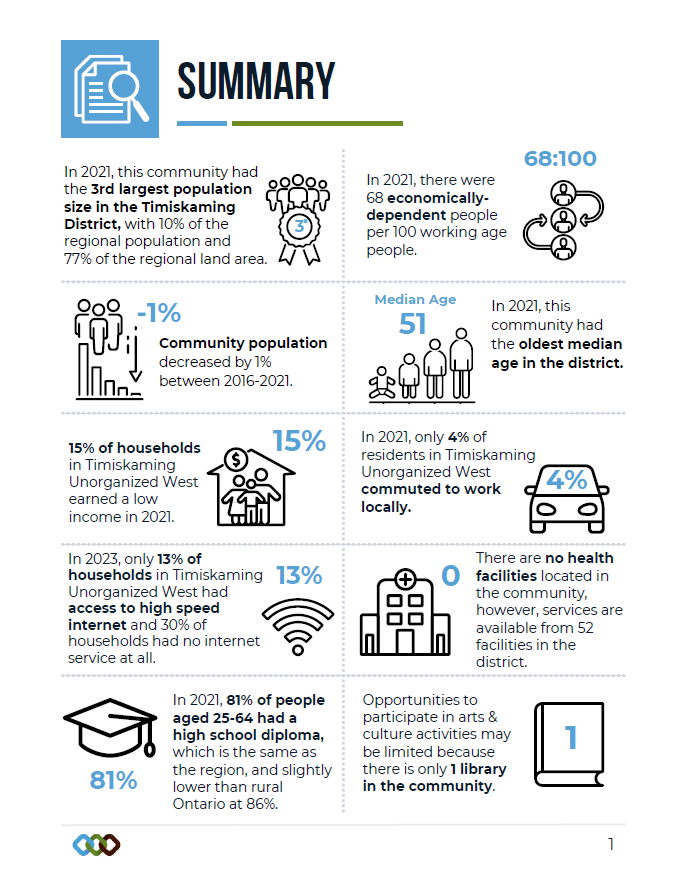
You can download PDF images of the dashboard to use as simple briefing materials. You can also download data if you are interested in conducting your own analysis of the information. However, if you need assistance with data analysis or reporting, ROI can provide you with a wellbeing report that features maps, data visualizations and easily understandable infographics.
 |
| Image: Example of infographic summary from a Community Wellbeing Report |
How Did We Get Here?
ROI has a long history of working with communities on economic development and leadership programs. We also published a longstanding series of factsheets to help inform rural communities. Over 2021-2023, ROI expanded our data analysis program and received funding for a project to create a rural community benchmarking service. The project involved selecting a set of indicators that would enable communities to compare themselves to their peers. The initial scope of work was to develop a pilot system with input and participation from four rural communities. We successfully created a pilot dashboard and held four community engagement sessions during this time. Early project work is described in our Phase 1 report.
For 2023-2025, ROI welcomed new partners to fund the expansion of the pilot program and to continue engaging with rural communities to mobilize knowledge. This is Phase 2 of the project, which was focused on dashboard development until the launch, and will now be focused on engagement and knowledge mobilization. We plan to publish a report summarizing Phase 2 work in spring 2025.
Challenges & Lessons Learned
The lack of community-level data was the most significant challenge we encountered while developing this dashboard. At many of the engagement sessions we held, our data champions were often shocked to learn how little data is actually available at the local level. Data for rural areas is often aggregated by region, or by some other jurisdictional boundary like health units or police districts that may not match community governance. So, we learned how important it is to improve data literacy and awareness of available data sources for decision making.
We also learned the limitations of working with data visualization software. We used Tableau to create this dashboard, which has some limitations regarding accessibility, language translation, and navigation. This was the best solution for our small budget, but we will strive to continually improve the user experience and accessibility of the dashboard.
What Does Success Look Like?
Our ultimate measure of success is that people can use the dashboard in their work. So, we hope to develop use cases that will help us know what works, what doesn't and how we can improve the dashboard. These stories will be the real measure of the dashboard’s success.
However, in terms of procedural success, we are celebrating the relationships we’ve built with our rural data champions. It's been really great to bring together such an engaged working group.
Moving forward, we look forward to continuing our engagement with champions and communities and mobilizing knowledge to help people make data-driven decisions that will improve wellbeing for all Ontarians.
About the Author

Danielle Letang is the Manager of Data Strategy at the Rural Ontario Institute. Before joining ROI, Danielle worked for federal and provincial governments on natural resource management, climate change research, and sustainability reporting. ROI’s data analysis program is focused on providing information and evidence for local decision making. Danielle develops interactive data dashboards, writes factsheets to present rural and urban trends, and leads the community wellbeing project. Please contact her at dletang@ruralontarioinstitute.ca if you have any questions about the dashboard, or if you’d like to schedule a demonstration.
Blog categories: Community Wellbeing, Data, Dashboard, Rural Ontario Institute